Highlighting fingerprints with RDKit#
← Previous | Next → July 21, 2022 () by Anders Lervik | Category: chemistry Tagged: cheminformatics | chemistry | fingerprint | jupyter | molecules | python | rdkit
Introduction#
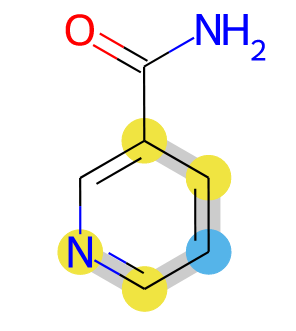
Fingerprints are interesting molecular descriptors, and RDKit can calculate many different fingerprints. Sometimes it can be informative to depict the on bits for fingerprints, and RDKit has methods for this. These methods focus on the environment of the central atom of the bit and do not show the whole molecule. Here is an example of how the whole molecule can be depicted together with the active bit(s), as in this image:

Example: Drawing fingerprint bits#
We start by importing RDKit (and matplotlib for showing some colors):
[1]:
from rdkit import Chem
from rdkit.Chem import (
    AllChem,
    rdCoordGen,
)
from rdkit.Chem import Draw
from rdkit.Chem.Draw import IPythonConsole
from matplotlib import pyplot as plt
from matplotlib.patches import Rectangle
from IPython.display import SVG

plt.style.use("seaborn-notebook")
IPythonConsole.ipython_useSVG = True  # Use higher quality images for molecules
I will use niacinamide as an example. Let us create it from smiles and draw the molecule with RDKit:
[2]:
niacinamide = Chem.MolFromSmiles("c1cc(cnc1)C(=O)N")
rdCoordGen.AddCoords(niacinamide)
niacinamide
[2]:
And we calculate the Morgan fingerprint with a radius of 2:
[3]:
info = {}
fp = AllChem.GetMorganFingerprintAsBitVect(niacinamide, radius=2, bitInfo=info)
RDKit already has methods for depicting bits from fingerprints:
[4]:
on_bits = [(niacinamide, i, info) for i in fp.GetOnBits()]
labels = [str(i[1]) for i in on_bits]
Draw.DrawMorganBits(on_bits, molsPerRow=5, legends=labels)  # Draw the on bits
[4]:

Now, we will draw the full molecule and highlight the atoms/bonds that are part of the bit.
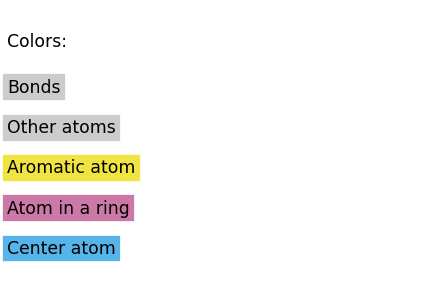
First, we define the colors to use for the highlighting. Here, I use the colormap of Okabe & Ito:
[5]:
COLOR_TUPLES = [
    (230, 159, 0),
    (86, 180, 233),
    (0, 158, 115),
    (240, 228, 66),
    (0, 114, 178),
    (213, 94, 0),
    (204, 121, 167),
    (204, 204, 204),  # Gray, added by me
]
COLOR_FRAC = [tuple(x / 255 for x in color) for color in COLOR_TUPLES]
COLOR_MAP = {
    "Center atom": COLOR_FRAC[1],
    "Atom in a ring": COLOR_FRAC[6],
    "Aromatic atom": COLOR_FRAC[3],
    "Other atoms": COLOR_FRAC[7],
    "Bonds": COLOR_FRAC[7],
}

fig, ax = plt.subplots(constrained_layout=True)
for i, (txt, color) in enumerate(COLOR_MAP.items()):
    ax.text(0, i, txt, va="center", fontsize="xx-large", backgroundcolor=color)
ax.text(0, 5, "Colors:", fontsize="xx-large")
ax.set_xlim(0.0, 0.6)
ax.set_ylim(-1, 6)
ax.axis("off");

Next, we define some methods that will add colors for us:
[6]:
def get_atom_colors(molecule, atoms, centers=None):
    """Define some colors for different atoms."""
    colors = {}
    for atom in atoms:
        if centers is not None and atom in centers:
            colors[atom] = COLOR_MAP["Center atom"]
        else:
            if molecule.GetAtomWithIdx(atom).GetIsAromatic():
                colors[atom] = COLOR_MAP["Aromatic atom"]
            elif molecule.GetAtomWithIdx(atom).IsInRing():
                colors[atom] = COLOR_MAP["Atom in a ring"]
            else:
                colors[atom] = COLOR_MAP["Other atoms"]
    return colors


def get_bond_colors(bonds):
    """Define colors for bonds."""
    return {bond: COLOR_MAP["Bonds"] for bond in bonds}
Let us take a look at the fingerprint info we get from the method generating the fingerprint:
[7]:
print(info[1043])
((0, 2),)
The bits are a tuple of tuples on the form: ((center, radius),) where center is the index of the center atom, and radius is the radius used in the fingerprint. For depicting the fingerprint, we will first grab the environment of the center atom within the radius.
[8]:
def get_environment(molecule, center, radius):
    """Get the environment of a certain radius around a center atom."""
    if not molecule.GetNumConformers():
        rdDepictor.Compute2DCoords(mol)
    env = Chem.FindAtomEnvironmentOfRadiusN(molecule, radius, center)
    atoms = set([center])
    bonds = set([])
    for bond in env:
        atoms.add(molecule.GetBondWithIdx(bond).GetBeginAtomIdx())
        atoms.add(molecule.GetBondWithIdx(bond).GetEndAtomIdx())
        bonds.add(bond)
    atoms = list(atoms)
    bonds = list(bonds)

    atom_colors = get_atom_colors(molecule, atoms, centers=set([center]))
    bond_colors = get_bond_colors(bonds)

    return atoms, bonds, atom_colors, bond_colors
Let us try this on bit 1043 where the center was 0 and the radius was 2:
[9]:
atoms, bonds, _, _ = get_environment(niacinamide, 0, 2)
print("Atoms:", atoms)
print("Bonds:", bonds)
Atoms: [0, 1, 2, 4, 5]
Bonds: [0, 8, 4, 1]
Let us check that we got the correct atoms and bonds, by labeling them by their index:
[10]:
mol = Chem.Mol(niacinamide)
for i in atoms:
    mol.GetAtomWithIdx(i).SetProp("atomNote", f"A-{i}")
for i in bonds:
    mol.GetBondWithIdx(i).SetProp("bondNote", f"B-{i}")
mol.GetAtomWithIdx(0).SetProp("atomNote", f"A-0 (center)")
canv = Draw.rdMolDraw2D.MolDraw2DSVG(250, 250)  # or MolDraw2DSVG
canv.DrawMolecule(
    mol,
    highlightAtoms=atoms,
    highlightBonds=bonds,
    highlightBondColors={i: (0.8, 0.8, 0.8) for i in bonds},
)
canv.FinishDrawing()
SVG(canv.GetDrawingText())
[10]:

So, we are able to pick out the correct atoms and bonds. We can also compare with the bit-drawing from RDKit:
[11]:
Draw.DrawMorganBit(niacinamide, 1043, info)
[11]:

OK, so that seems to work fine. Let us put all that into a method that will draw a selected bit. Since each bit can occur several times in the same molecule, we will draw a grid to handle that:
[12]:
def draw_molecule_and_bit_info_grid(
    molecule, info, bit, max_examples=None, mols_per_row=3
):
    """Highlight a bit in a given molecule."""
    atoms_to_highlight = []
    bonds_to_highlight = []
    atoms_to_highlight_colors = []
    bonds_to_highlight_colors = []
    molecules_to_draw = []
    for i, example in enumerate(info[bit]):
        if max_examples is not None and i + 1 > max_examples:
            break
        center, radius = example
        atoms, bonds, atom_colors, bond_colors = get_environment(
            molecule, center, radius
        )
        atoms_to_highlight.append(atoms)
        bonds_to_highlight.append(bonds)
        atoms_to_highlight_colors.append(atom_colors)
        bonds_to_highlight_colors.append(bond_colors)
        molecules_to_draw.append(molecule)

    options = Draw.rdMolDraw2D.MolDrawOptions()
    options.prepareMolsForDrawing = True
    options.fillHighlights = True
    return Draw.MolsToGridImage(
        molecules_to_draw,
        molsPerRow=min(mols_per_row, len(molecules_to_draw)),
        subImgSize=(200, 200),
        highlightAtomLists=atoms_to_highlight,
        highlightBondLists=bonds_to_highlight,
        highlightAtomColors=atoms_to_highlight_colors,
        highlightBondColors=bonds_to_highlight_colors,
        drawOptions=options,
    )
[13]:
draw_molecule_and_bit_info_grid(niacinamide, info, 1043)
[13]:

Let us also make a variant that will show all on bits, but we keep it to a single example per bit:
[14]:
def show_all_on_bits(molecule, info):
    """Draw all on bits"""
    atoms_to_highlight = []
    bonds_to_highlight = []
    atoms_to_highlight_colors = []
    bonds_to_highlight_colors = []
    molecules_to_draw = []
    legends = []
    for key in sorted(info.keys()):
        center, radius = info[key][0]
        legends.append(f"Bit {key}")
        atoms, bonds, atom_colors, bond_colors = get_environment(
            molecule, center, radius
        )
        atoms_to_highlight.append(atoms)
        bonds_to_highlight.append(bonds)
        atoms_to_highlight_colors.append(atom_colors)
        bonds_to_highlight_colors.append(bond_colors)
        molecules_to_draw.append(molecule)

    options = Draw.rdMolDraw2D.MolDrawOptions()
    options.prepareMolsForDrawing = True
    options.fillHighlights = True
    return Draw.MolsToGridImage(
        molecules_to_draw,
        molsPerRow=min(5, len(molecules_to_draw)),
        subImgSize=(150, 150),
        legends=legends,
        highlightAtomLists=atoms_to_highlight,
        highlightBondLists=bonds_to_highlight,
        highlightAtomColors=atoms_to_highlight_colors,
        highlightBondColors=bonds_to_highlight_colors,
        drawOptions=options,
    )
[15]:
show_all_on_bits(niacinamide, info)
[15]:

Summary#
The code above can be used to depict Morgan fingerprint bits together with a molecule. This can make it easier to understand what the bit is measuring the presence of.